This is an old revision of the document!
Utility
Utility is an ordinal concept that allows a consumer to rank choices.
Consumers behave to maximize their utility. They have preferences, which is what they want, and they get as much as possible within a certain budget.
Preference assumptions
We make three assumptions about the preferences of consumers:
- Completeness: Consumers do have an opinion on all possible choices.
- Transitivity: $ A > B, B > C \implies A > C $
- Non-satiation: More is always better.
- Marginal utility is always positive.
Indifference curves
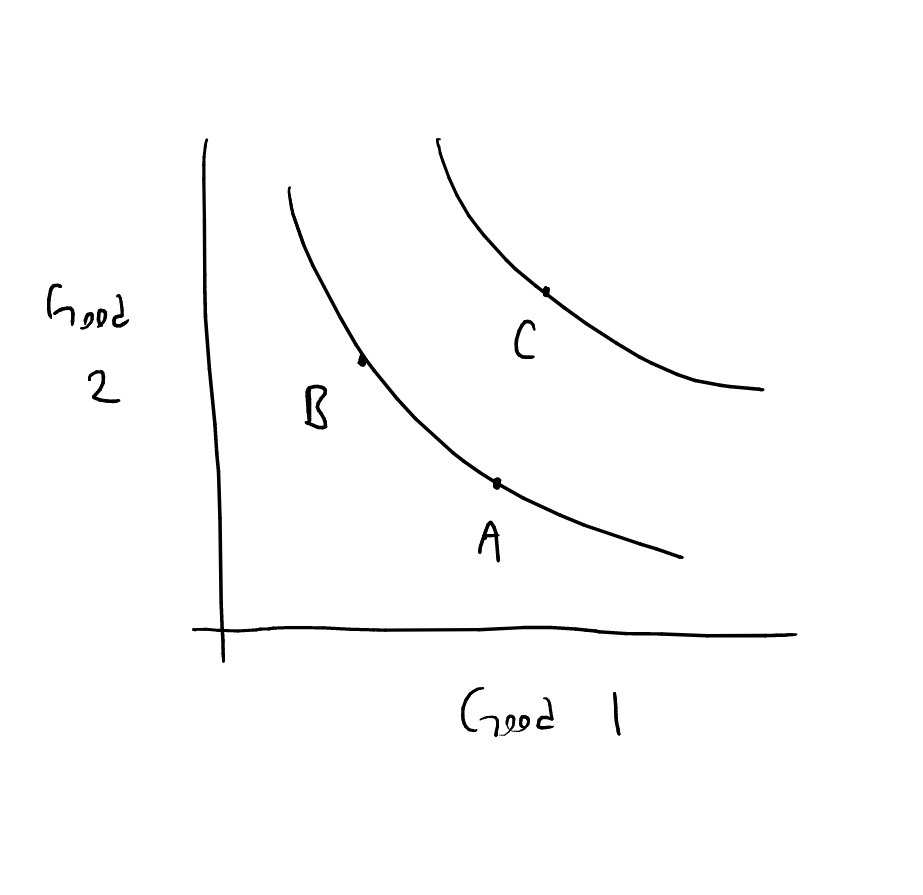
A plot of indifference curves is a graphical map of preferences. The two axes on such a plot are two different goods, and a consumer is indifferent between any of the combinations of goods on an indifference curve.
Properties of indifference curves
- Consumers prefer higher indifference curves.
- Indifference curves must slope downwards due to non-satiation.
- Indifference curves may not cross due to transitivity.
- There is only one indifference curve through every possible combination of goods.
Utility functions
A utility function is a mathematical representation of the preferences of a consumer.
Consider the following utility function for an individual consuming good X and good Y:
$$ U = \sqrt{XY} $$
Marginal utility is the derivative of utility with respect to the quantity of a good. Marginal utility generally diminishes as the number of goods consumed increases. The marginal utility for good X in the example is:
$$ \frac{\partial U}{\partial X} = \frac{1}{2}\sqrt{\frac{Y}{X}} $$
We can see that this quantity decreases for increasing values of $X$.
Marginal rate of substitution
The marginal rate of substitution is the slope of the indifference curve. It denotes the quantity of one good that you are willing to give up to get one more of another good.
$$ MRS = \frac{\Delta Y}{\Delta Y} $$
